
Unleashing the Power of the Zerto Analytics API
Modern companies of any size embrace APIs as a critical part of their business. Recently, we have made all of our Zerto Analytics APIs publicly available for users running ZVR 5.0-6! This means that ANYTHING you see in Zerto Analytics you can get via API. Cloud Service Providers should be especially excited about this because we have now given them the ability to customize their cloud service portals and differentiate their offerings and services.
We’ve even given our APIs a bit more ‘Swagger’, using the same-name delivery method to make it incredibly easy to start using these APIs (https://docs.api.zerto.com/). Swagger allows you to not only browse the API structure but also shows you exactly what kind of responses you can expect and you can even execute calls from an easy to use web interface.
The reason I am really excited by this release is that it allows me to use a single endpoint to pull analytics data from all my Zerto installations without me having to connect to every local ZVM to get this information. Basically we have 2 API’s available;
- Monitoring API; allows you access to real time monitoring information about your environments, including information about VPGs, Tasks, Alerts and Events.
- Rerporting API; allows you access to reporting information, including information about your RPO, Journal and Network performance of up to one month
But enough talk about how great it is… let start using it. In this blog I will use the Zerto Analytics API to pull RPO statistics for a specific VPG and will use the script to integrate this data into PRTG Network Monitor (see: https://www.paessler.com/). The reason I picked PRTG is because I used to work with this tool in the past and have integrated many other things into this and I happen to know that some of our own users have this in place.
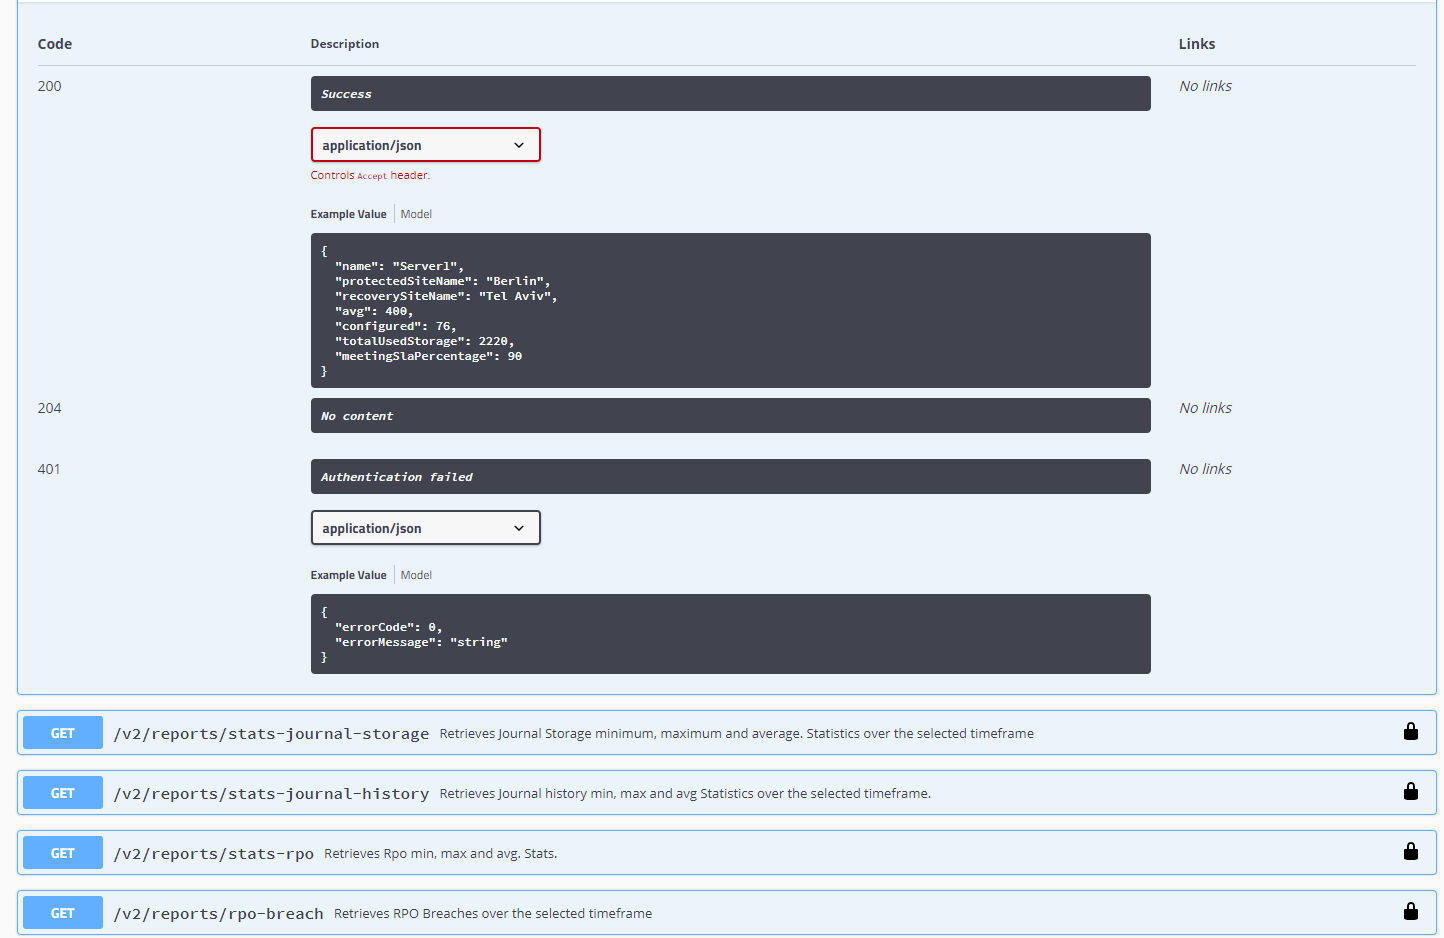
We are going to use the Reporting API for this and specifically the stats-rpo call.
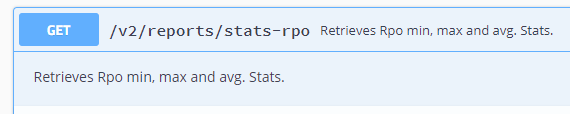
This will return the average, minimum and maximum RPO for a given timeframe. The reason I will use this one is that it will allow us to also identify spikes in RPO even if we are not pulling the data every few seconds.
Let’s start coding!
The first thing we need to do is get a token from the API (by using our username and password) to use in our following API calls. As already revealed by using the word “token” the Zerto Analytics API uses token authentication (aka bearer authentication) which uses security tokens called bearer tokens. The following piece of code gets the token and builds the header we can use every subsequent API call.
#CHANGE THESE: Username and password for Zerto Analytics
$zaUsername = “username”
$zaPassword = “password”
[System.Net.ServicePointManager]::SecurityProtocol = [System.Net.SecurityProtocolType]::Tls12 -bor [System.Net.SecurityProtocolType]::Tls11
#Getting Zerto Analytics Token
$body = ‘{“username”: “‘ + $zaUsername + ‘”,”password”:”‘ + $zaPassword + ‘”}’
$contentType = “application/json”
$xZertoAnalyticsToken = Invoke-RestMethod -Uri “https://analytics.api.zerto.com/v2/auth/token” -Method POST -Body $body -ContentType $contentType
#Build authorization header
$authHeaders = @{“Authorization” = “Bearer ” + $xZertoAnalyticsToken.token}
With that being done we can now start getting the RPO stats by using the stats-rpo call. What we want to achieve is getting the stats for the last 5 minutes every time the script runs, the call uses the following parameters:
- startDate
The starting date of the report, in RFC 3339 standard (‘1970-01-01T00:00:00Z’). If only the end date is added, the start date by default will be the end date minus 7 days. - endDate
The end date of the report, in RFC 3339 standard (‘1970-01-01T00:00:00Z’). The default is the current time. - vpgIdentifier
The identifier of the VPG.
We are going the use only the “startDate” and “vpgIdentifier” parameters as the “endDate” defaults to the current time. The “startDate” will be the current time minus 5 minutes, to get that time we are using the following code:
#Get the current time

$CurrentDateTime = Get-Date
#Get current time -5 minutes to pull statistics from last 5 minutes
$ts = New-TimeSpan -Minutes 5
$FiveMinutesAgo = Get-Date($CurrentDateTime-$ts) -Format O
#URL Encode time to use in API call
$FiveMinutesAgo = [System.Web.HttpUtility]::UrlEncode($FiveMinutesAgo)
With this being done we are all set to get that data using the VPG Identifier of the VPG you want to monitor. The code below gets the data from the API and stores it in the vpgRpoStats variable using the time we just calculated (current time minus 5 minutes) and the VPG Identifier.
#Set the vpgIdentifier of the VPG you want to pull statistics for

$vpgIdentifier = "0c387394-320c-466c-ffff-78021f9fffff"
#Get RPO statistics for VPG
$getRpoStatsUrl = “https://analytics.api.zerto.com/v2/reports/stats-rpo?startDate=” + $FiveMinutesAgo + “&vpgIdentifier=” + $vpgIdentifier
$vpgRpoStats = Invoke-RestMethod -Uri $getRpoStatsUrl -Headers $authHeaders
TIP: You can find the VPG Identifier in the address bar of your browser when you visit Zerto Analytics and go the the VPG you want to monitor.
![]()
Use this in PRTG
As promised I am going to use the script to pull this data into PRTG Network Monitor. To be able to do so, PRTG expects the data in a certain format so it will be automatically recognizing the channels it should use. The following piece of code takes the results we stored in vpgRpoStats and will print it in the desired format:
$avg = $vpgRpoStats.avg

$max = $vpgRpoStats.max

$min = $vpgRpoStats.min
Write-Host @”
<prtg>
<result>
<channel>AvgRPO</channel>
<unit>TimeSeconds</unit>
<value>$avg</value>
<float>1</float>
</result>
<result>
<channel>MaxRPO</channel>
<unit>TimeSeconds</unit>
<value>$max</value>
<float>1</float>
</result>
<result>
<channel>MinRPO</channel>
<unit>TimeSeconds</unit>
<value>$min</value>
<float>1</float>
</result>
</prtg>
“@
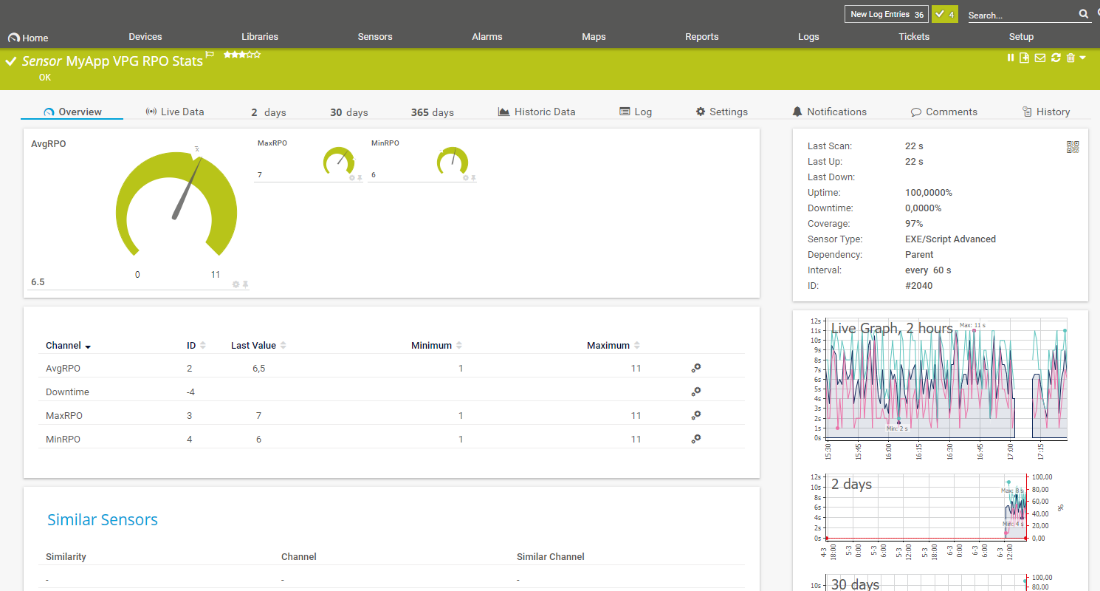
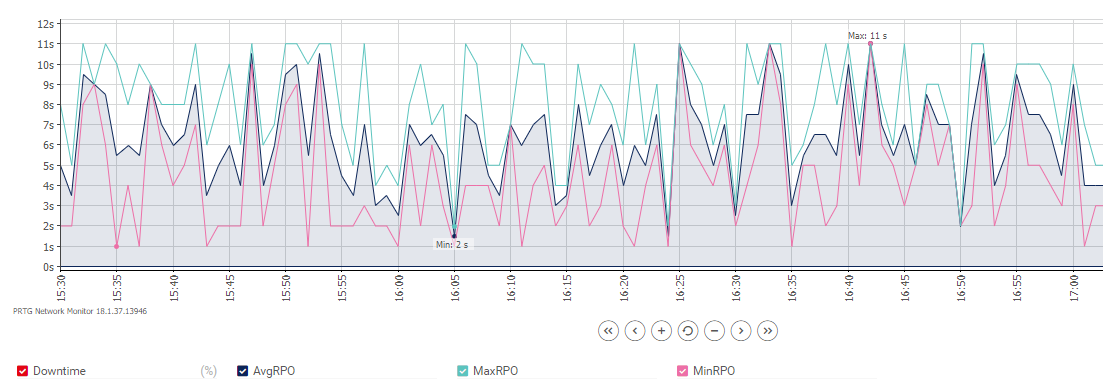
You can now use this script and place it in the Customer Sensors/EXEXML folder of your PRTG installation and create an EXE/Script Advanced Sensor. This will result in dashboards and graphs and it will also allow you to set limits and configure alerting based on those limits.
So much more….
Of course, you can do many many more things using this API and we will definitely share more examples and use cases. Also, this script can be extended in many ways but this does show you how easy it is to start using the Zerto Analytics API. I would love to invite everyone to start coding and please do not hesitate to share your results and hard work on myZerto!